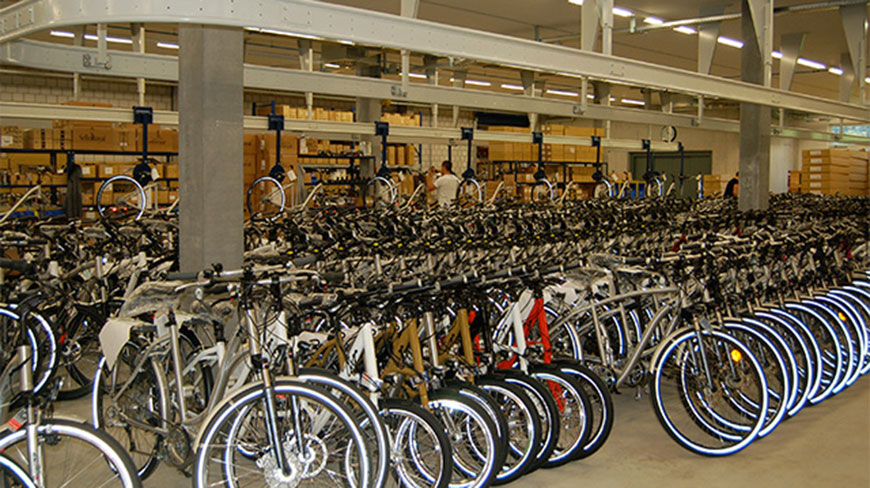
Global sales from bicycles exports by country amounted to US$8.9 billion in 2016.
Overall, the value of bicycles exports were down by an average -1.5% for all exporting countries since 2012 when bicycles shipments were valued at $9.1 billion. Year over year, the exported bicycles retreated by -6.7% from 2015 to 2016.
Among continents, Asian countries accounted for the highest dollar worth of exported bicycles during 2016 with shipments valued at $5.5 billion or 61.9% of the global total.
Over a third (36%) was shipped by European exporters while a much smaller percentage (1.4%) originated from North America.
The 4-digit Harmonized Tariff System code prefix is 8712 for non-motorized bicycles (and other cycles including delivery tricycles).
Countries
Bicycles Exports by Country
Below are the 15 countries that exported the highest dollar value worth of bicycles during 2016:
- China: US$3.1 billion (35.2% of total bicycles exports)
- Taiwan: $1.5 billion (16.8%)
- Netherlands: $755.3 million (8.5%)
- Germany: $619.4 million (6.9%)
- Cambodia: $413.7 million (4.6%)
- Portugal: $244.3 million (2.7%)
- Belgium: $207.3 million (2.3%)
- Hungary: $205.2 million (2.3%)
- Italy: $190.5 million (2.1%)
- Bulgaria: $146 million (1.6%)
- Spain: $122.2 million (1.4%)
- Poland: $115.5 million (1.3%)
- France: $110.1 million (1.2%)
- Austria: $105.5 million (1.2%)
- United States: $100 million (1.1%)
The listed 15 countries shipped 89.3% of global bicycles exports in 2016 by value.
Among the above countries, the fastest-growing bicycles exporters since 2012 were: Cambodia (up 113.7%), Hungary (up 107.8%), Portugal (up 37.7%) and Poland (up 35.9%).
Those countries that posted declines in their exported bicycles sales were led by: France (down -30.3%), Spain (down -26.3%), Taiwan (down -20.3%), United States (down -20.1%) and Belgium (down -18.8%).
Advantages
The following countries posted the highest positive net exports for bicycles during 2016. Investopedia defines net exports as the value of a country’s total exports minus the value of its total imports. Thus, the statistics below present the surplus between the value of each country’s exported bicycles and its import purchases for that same commodity.
- China: US$3.1 billion (net export surplus down -1.7% since 2012)
- Taiwan: $1.5 billion (down -21.1%)
- Cambodia: $405 million (up 122.7%)
- Netherlands: $343.5 million (up 30.3%)
- Portugal: $223.6 million (up 57.2%)
- Hungary: $177.3 million (up 104.2%)
- Bulgaria: $144.1 million (up 31.9%)
- Indonesia: $51.2 million (down -40.4%)
- Bangladesh: $50.6 million (down -53.7%)
- Romania: $44.2 million (down -32.4%)
- Italy: $42.3 million (up 125.1%)
- Poland: $41 million (up 49.9%)
- Tunisia: $40.9 million (up 12.3%)
- Sri Lanka: $35.1 million (down -11.9%)
- Turkey: $33.1 million (up 36.7%)
China has the highest surplus in the international trade of bicycles. In turn, this positive cashflow confirms strong Chinese competitive advantage for this specific product category.
Opportunities
The following countries posted the highest negative net exports for bicycles during 2016. Investopedia defines net exports as the value of a country’s total exports minus the value of its total imports. Thus, the statistics below present the deficit between the value of each country’s imported bicycles purchases and its exports for that same commodity.
- United States: -US$1.4 billion (net export deficit down -10.6% since 2012)
- Japan: -$654.6 million (down -24.2%)
- United Kingdom: -$427.4 million (down -0.8%)
- France: -$246.8 million (up 13.5%)
- South Korea: -$204.1 million (up 18%)
- Canada: -$202.4 million (up 1.2%)
- Australia: -$185.3 million (down -21.8%)
- Switzerland: -$170.5 million (down -0.5%)
- Spain: -$146.7 million (up 11%)
- Denmark: -$109.2 million (down -20.7%)
- Norway: -$95.7 million (down -23.6%)
- Sweden: -$85.8 million (up 10.5%)
- Iran: -$77 million (up 120%)
- Belgium: -$69.3 million (up 8.4%)
- Russia: -$63.8 million (down -38.3%)
The United States incurred the highest deficit in the international trade of bicycles. In turn, this negative cashflow highlights America’s strong competitive disadvantage for this specific product category but also signals opportunities for bicycles-supplying countries that help satisfy the powerful demand.
Companies
Bicycles Exporting Companies
Below are global bicycles-processing conglomerates that represent established players engaged in the international bicycles trade. Their home country is shown within parenthesis.
- Flying Pigeon (China)
- Phoenix Bicycles (China)
- Giant Manufacturing (Taiwan)
- Batavus (Netherlands)
- Canyon Bicycles GmbH (Germany)
- Órbita – Bicicletas Portuguesas, Lda. (Portugal)
- Eddy Merckx (Belgium)
- Gepida (Hungary)
- ALAN (Italy)
- Beistegui Hermanos S.A. (Spain)
- Kross SA (Poland)
- Cyfac (France)
- Puch (Austria)
- Rowbike (United States)
Source: worldstopexports.com
