

Oil is the world’s number 1 export product. Amounting to 4.8% of the global value of all export products, crude oil shipments totaled US$786.3 billion for 2015.
That figure represents a -50.3% drop in value since 2011 and a -44.4% decline from 2014 to 2015.
Middle Eastern countries accounted for the highest dollar value worth of crude oil exports during 2015 with shipments valued at $325 billion or 41.3% of global crude oil exports. This compares with 18% for Europe, 9.9% for North America and 7.7% for Latin America (excluding Mexico) and Caribbean exporters.
The 4-digit Harmonized Tariff System code prefix for crude oil is 2709.
Crude Oil Exports by Country
Countries
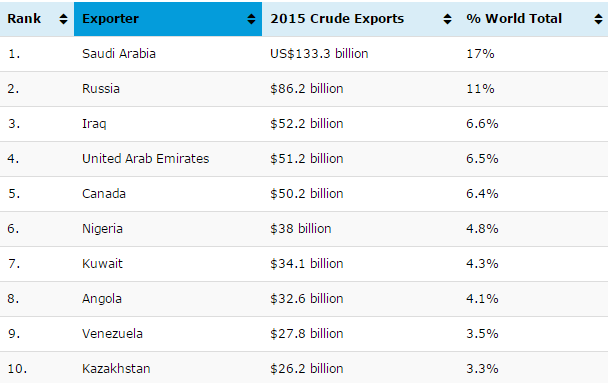
Below are the 15 countries that exported the highest dollar value worth of crude oil during 2015:
- Saudi Arabia: US$133.3 billion (17% of total crude oil exports)
- Russia: $86.2 billion (11%)
- Iraq: $52.2 billion (6.6%)
- United Arab Emirates: $51.2 billion (6.5%)
- Canada: $50.2 billion (6.4%)
- Nigeria: $38 billion (4.8%)
- Kuwait: $34.1 billion (4.3%)
- Angola: $32.6 billion (4.1%)
- Venezuela: $27.8 billion (3.5%)
- Kazakhstan: $26.2 billion (3.3%)
- Norway: $25.7 billion (3.3%)
- Iran: $20.5 billion (2.6%)
- Mexico: $18.8 billion (2.4%)
- Oman: $17.4 billion (2.2%)
- United Kingdom: $16 billion (2%)
All of the above international traders posted declines in the value of their crude oil exports from 2011 to 2015, ranging from -27.7% for Canada to -75.7% for Iran. Besides Iran, other fast-declining oil exporters were: Mexico (down -62%), Nigeria (down -57.8%), Norway (down -56.7%) and Venezuela (down -54.4%).
The listed 15 countries accounted for 80.5% of all crude oil exports in 2015 (by value).
Advantages
The following countries posted the highest positive net exports for crude oil during 2015. Investopedia defines net exports as the value of a country’s total exports minus the value of its total imports. Thus, the statistics below present the surplus between the value of each country’s crude oil exports and its import purchases for that same commodity.
- Saudi Arabia: US$133.3 billion (net export surplus down -51.8% since 2011)
- Russia: $85.5 billion (down -50.2%)
- Iraq: $52.2 billion (down -32.3%)
- United Arab Emirates: $51 billion (down -47.2%)
- Nigeria: $38 billion (down -57.8%)
- Canada: $37 billion (down -8.9%)
- Kuwait: $34.1 billion (down -50.4%)
- Angola: $32.6 billion (down -48.4%)
- Venezuela: $27.8 billion (down -54.4%)
- Kazakhstan: $26.2 billion (down -50.3%)
- Norway: $25.2 billion (down -56.7%)
- Iran: $20.4 billion (down -75.9%)
- Mexico: $18.8 billion (down -62%)
- Oman: $17.4 billion (down -37.1%)
- Azerbaijan: $13 billion (down -43.2%)
Saudi Arabia has the highest surplus in the international trade of crude oil. In turn, this positive cashflow confirms Saudi’s strong competitive advantage for this specific product category.
Opportunities
The following countries posted the highest negative net exports for crude oil during 2015. Investopedia defines net exports as the value of a country’s total exports minus the value of its total imports. Thus, the statistics below present the deficit between the value of each country’s crude oil import purchases and its exports for that same commodity.
- China: -US$132.8 billion (net export deficit down -31.9% since 2011)
- United States: -$123.9 billion (down -63.6%)
- India: -$72.3 billion (down -40.8%)
- South Korea: -$55.1 billion (down -45.3%)
- Japan: -$45.0 billion (down -68.3%)
- Germany: -$36.4 billion (down -48.5%)
- Netherlands: -$26.6 billion (down -41.9%)
- Spain: -$24.0 billion (down -41.1%)
- Italy: -$23.4 billion (down -59.1%)
- France: -$22.8 billion (down -56.1%)
- Thailand: -$19.4 billion (down -38.5%)
- Singapore: -$18.2 billion (down -45.7%)
- Taiwan: -$16.1 billion (down -47.2%)
- Belgium: -$13.7 billion (down -45.4%)
- Poland: -$9.7 billion (down -45.2%)
In a dramatic change from 2014 when America incurred the greatest shortfall, China incurred the highest deficit in the international trade of crude oil albeit at a slowing pace given the -31.9% drop in deficit size since 2011. Still, the negative cashflow highlights China’s strong competitive disadvantage for this specific product category but also signals opportunities for crude oil-supplying countries that help satisfy the powerful demand and for entrepreneurs who develop alternative energy sources that can power industrial economies.
Crude Oil Exporting Companies
Companies
Based on the Forbes 2015 Global 2000 rankings, the following oil and gas companies are among the top 100 largest companies in the world:
- Exxon Mobil (United States)
- PetroChina (China)
- Royal Dutch Shell (Netherlands)
- BP (United Kingdom)
- Chevron (United States)
- Gazprom (Russia)
- Total (France)
- Sinopec-China Petroleum (China)
- Petrobras (Brazil)
- Rosneft (Russia)
- Eni (Italy)
- Statoil (Norway)
- ConocoPhillips (United States)
- LukOil (Russia)
The above corporations are presented in the same order as they appear in the Forbes listing. Shown within parentheses is the country where each conglomerate has its headquarters.
Top 10 Crude Oil Exporting Countries
Source: worldstopexports.com