Nickel exports by country totaled US$4.6 billion in 2019, accelerating by 61.5% for all nickel ores shippers over the five-year period starting in 2015. Globally, the value of exported nickel spiked by an average 61.1% from 2018 to 2019.
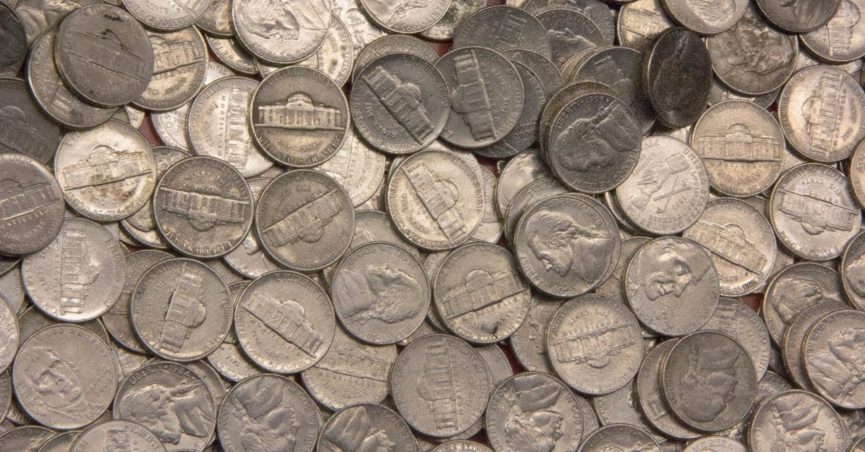
Resistant to corrosion, nickel is used in stainless steel, magnets, coins, rechargeable batteries as well as plating on plumbing fixtures and a green tint in glass.
Among continents, suppliers located in Asian countries sold the highest dollar worth of exported nickel during 2019 with shipments valued at $2.3 billion or 50.2% of the global total. In second place were exporters in Africa at 18.9% while 17.1% of worldwide nickel shipments originated from Oceania’s New Caledonia, Australia and Papua New Guinea. Smaller percentages came from North America (7.4%), Europe (6%) and Latin America (0.5%) excluding Mexico but including the Caribbean.
For research purposes, the 4-digit Harmonized Tariff System code prefix is 2604 for nickel ores and concentrates.
Countries
Below are the 15 countries that exported the highest dollar value worth of nickel during 2019.
- Indonesia: US$1.7 billion (37.2% of total nickel exports)
- Zimbabwe: $737.1 million (16.0%)
- Philippines: $600.4 million (13.0%)
- New Caledonia: $480.4 million (10.4%)
- Australia: $307.5 million (6.7%)
- Finland: $241.7 million (5.2%)
- United States: $177.7 million (3.8%)
- Canada: $163.1 million (3.5%)
- Ivory Coast: $120.3 million (2.6%)
- Guatemala: $23.0 million (0.5%)
- Russia: $19.7 million (0.4%)
- Zambia: $14.6 million (0.3%)
- Albania: $6.9 million (0.2%)
- Belgium: $2.5 million (0.1%)
- Germany: $2.3 million (0.05%)
By value, the listed 15 countries shipped 99.9% of global nickel exported in 2019.
Among the top exporters, the fastest-growing nickel exporters since 2015 were: Belgium (up 3,100%), Zimbabwe (up 237.5%), Finland (up 135.1%) and Russia (up 119.5%).
Those countries that posted declines in their exported nickel sales were led by: Guatemala (down -73.5%), Germany (down -55.8%), United States (down -49.6%), Australia (down -41.3%) and Philippines (down -18.8%).
Advantages
The following countries posted the highest positive net exports for nickel during 2019. Investopedia defines net exports as the value of a country’s total exports minus the value of its total imports. Thus, the statistics below present the surplus between the value of each country’s exported nickel and its import purchases for that same commodity.
- Indonesia: US$1.7 billion (net export surplus, no 2015 data)
- Zimbabwe: $737.1 million (up 237.5% since 2015)
- Philippines: $600.3 million (down -18.9%)
- New Caledonia: $480.4 million (up 114.2%)
- Australia: $307.4 million (down -39.4%)
- United States: $177.6 million (down -49.6%)
- Ivory Coast: $120.3 million (no 2015 data)
- Canada: $107.9 million (down -620.9%)
- Guatemala: $23 million (down -73.5%)
- Russia: $19.7 million (down -166.3%)
- Finland: $14.8 million (down -107.8%)
- Zambia: $14.6 million (no 2015 data)
- Albania: $6.9 million (down -4.6%)
- Turkey: $1.6 million (down -56.6%)
- France: $555,000 (reversing a -$1.8 million deficit)
Eclipsing the Philippines since 2018, Indonesia generated the highest surplus in the international trade of nickel. In turn, this positive cashflow confirms the strong Indonesian competitive advantage for this specific product category.
Opportunities
The following countries posted the highest negative net exports for nickel during 2019. Investopedia defines net exports as the value of a country’s total exports minus the value of its total imports. Thus, the statistics below present the deficit between the value of each country’s imported nickel purchases and its exports for that same commodity.
- China: -US$3.9 billion (net export deficit up 48.3% since 2015)
- South Korea: -$232.7 million (up 46%)
- Japan: -$217.6 million (down -26%)
- North Macedonia: -$136.9 million (up 54%)
- Ukraine: -$14.8 million (down -82.9%)
- Greece: -$4.1 million (reversing a $3,000 surplus)
- Germany: -$3.7 million (reversing a $518,000 surplus)
- Cyprus: -$1.2 million (no 2015 data)
- Italy: -$736,000 (up 1,068%)
- Brazil: -$507,000 (reversing a $126 million surplus)
- Vietnam: -$251,000 (reversing a $78.3 million surplus)
- Malaysia: -$224,000 (reversing a $712,000 surplus)
- Portugal: -$132,000 (up 300%)
- Cambodia: -$98,000 (no 2015 data)
- Austria: -$69,000 (up 6,800%)
The People’s Republic of China incurred the highest deficit in the international trade of nickel. In turn, this negative cashflow highlights China’s competitive disadvantage for this specific product category but also signals opportunities for nickel-supplying countries that help satisfy the powerful demand.
Companies
Nickel Producing Companies
Below are 10 of the largest nickel producers that represent established players engaged in the international trade of nickel. Their home country for each company’s headquarters is shown within parenthesis.
- Norilsk Nickel (Russia)
- Vale (Brazil)
- BHP Billiton (Australia)
- Jinchuan Group (China)
- Glencore (Switzerland)
- Sherritt International (Canada)
- Eramet (France)
- Sumitomo Metal Mining (Japan)
- Anglo American (UK/South Africa)
- Minara Resources (Australia)
According to global trading platform Alibaba, the following suppliers are also examples of nickel ore exporters. The home-country location for each business is shown within parentheses.
- Philminerals Inc (Philippines)
- Zeil Global Enterprises (United States)
- Metores Oy (Finland)
- Cornerstone (Indonesia)
- Osho Metal Ve Madencilik (Turkey)
- FENI Industries (Macedonia)
Source: worldstopexports.com
